Data
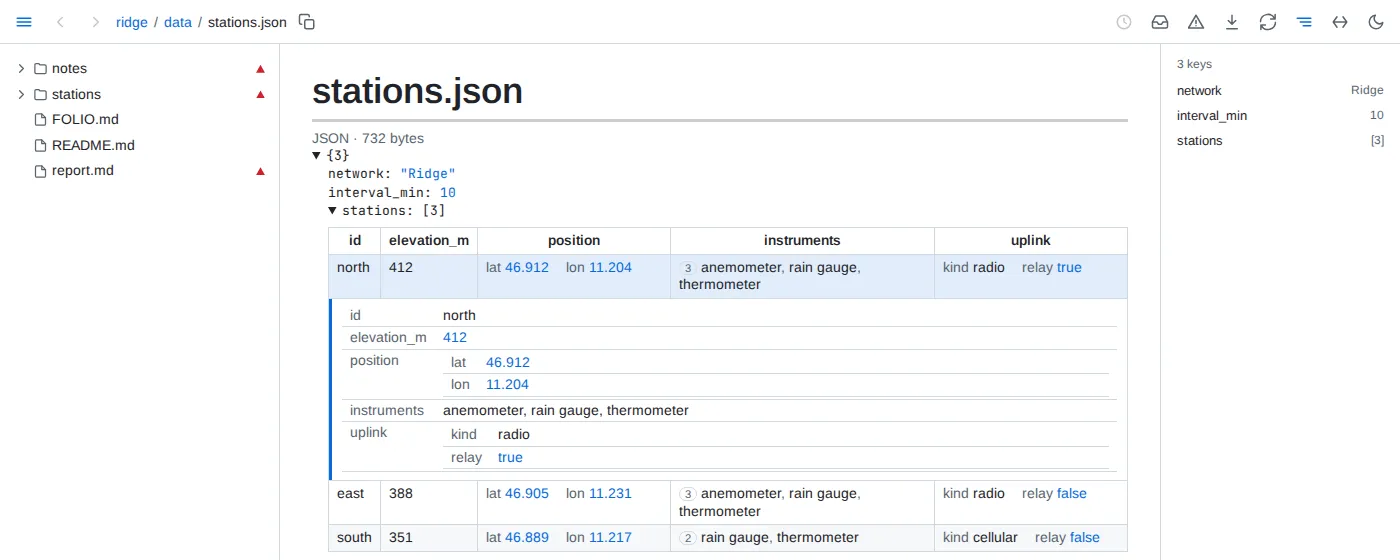
Data files open as pages - CSV, TSV, JSON Lines, Parquet, JSON, YAML, SQLite and DuckDB files open in the browser: rows as a table whose rows open into their records - a long file 200 rows at a time, sorted and filtered over all of it - nested data as a tree that folds with its records as tables, a database as its tables. Under each column's header a strip shows how its values spread over the whole file, the side panel lists the fields, and a value or a bar picked there filters every view to the records holding it, with the filter as a query to copy. A card above a filter's records names what sets them apart from the rest, and a field of a few values compares every other field by its values. Used by below a file lists the documents that read it. The tree hides data files until you press the table button at its top.
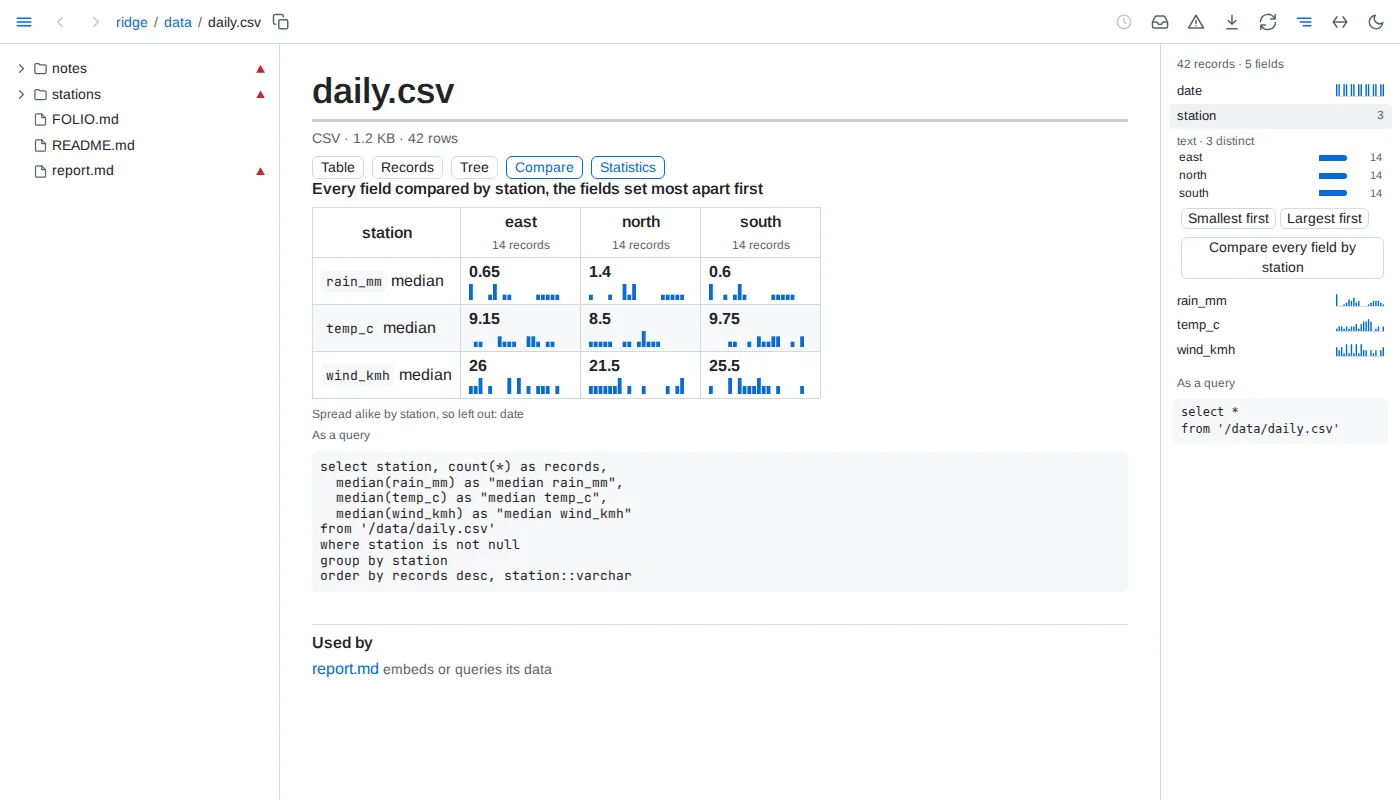
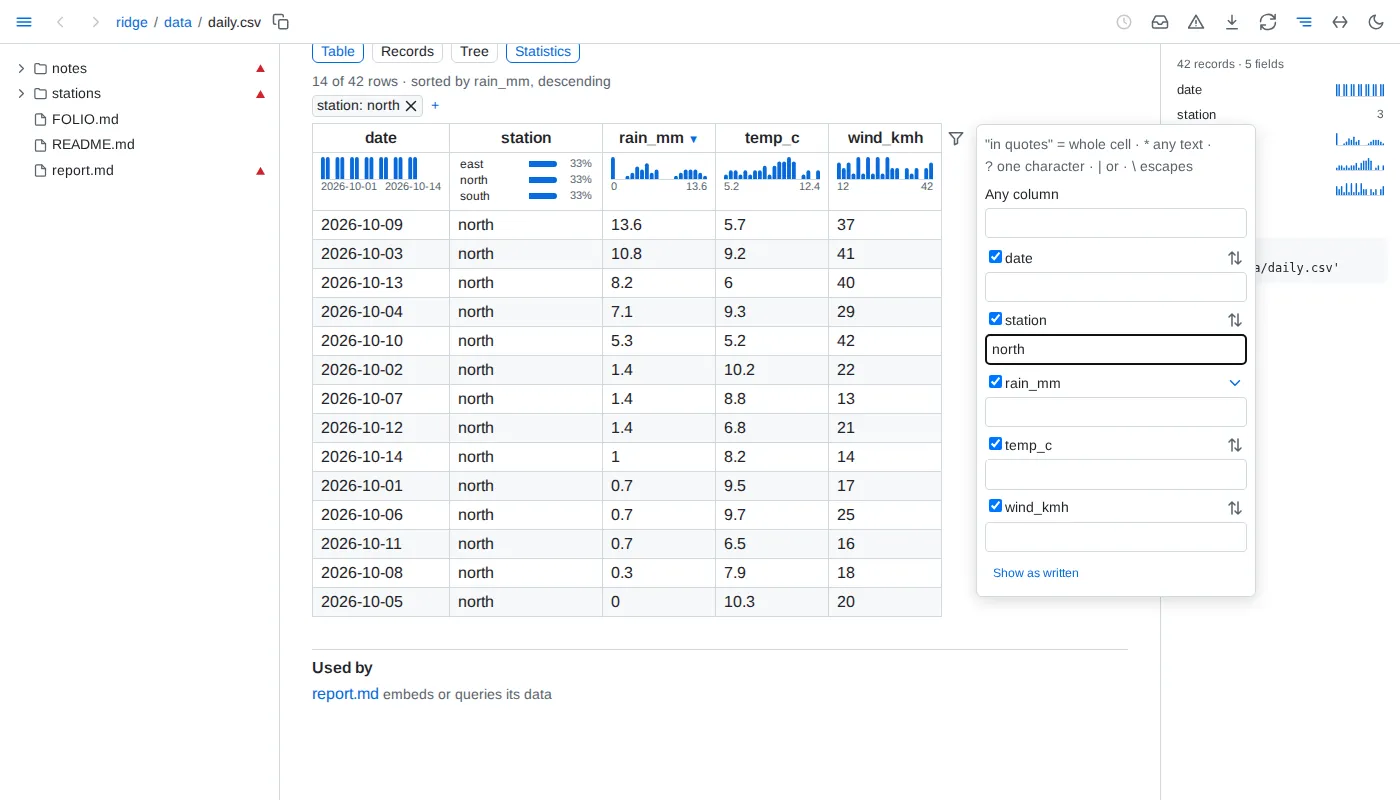
Tables that sort and filter - click a column's header to sort by it, again to reverse, a third time to go back to the order as written; Alt+click another header to add it as a further level, ordering the rows the levels before it leave equal. The filter button beside a table's corner filters all rows or one column's - text in quotes, "open", keeps only the cells equal to it, no* those starting with no and "open" | "review" either value, and a column of 12 values or fewer lists them with their counts to pick from, Alt+click adding one more - and hides columns. The filters show as badges on a strip above the rows, joined by and or or: a click on the word flips it, a badge drags to another place on the line, and its x removes it. The filter button in a cell's corner filters its column to the cell's value, Alt+click adding the value to the column's filter. None of it touches the file, a save keeps the view, and the view lives in the page's address, so a copied link reopens it.
Data in a document - a line reading {table: queries/wettest.sql} shows a result as a table, {value: #totals#0.rain_mm} puts one value in a sentence, and a ```vega-lite fence draws a chart from the file its data.url names. A ```sql query fence runs SQL over the folder's data files - any formats, joined - and shows its result below it; named, as ```sql query totals, its result serves a value, table, chart or figure elsewhere on the page as #totals. A query kept in its own .sql file is used by its path. Each of them redraws when its data changes.
The network logged {value: #totals#0.rain_mm} mm of rain.
```sql query totalsselect round(sum(rain_mm), 1) as rain_mm, round(avg(temp_c), 1) as temp_cfrom 'data/daily.csv'```
{table: queries/wettest.sql}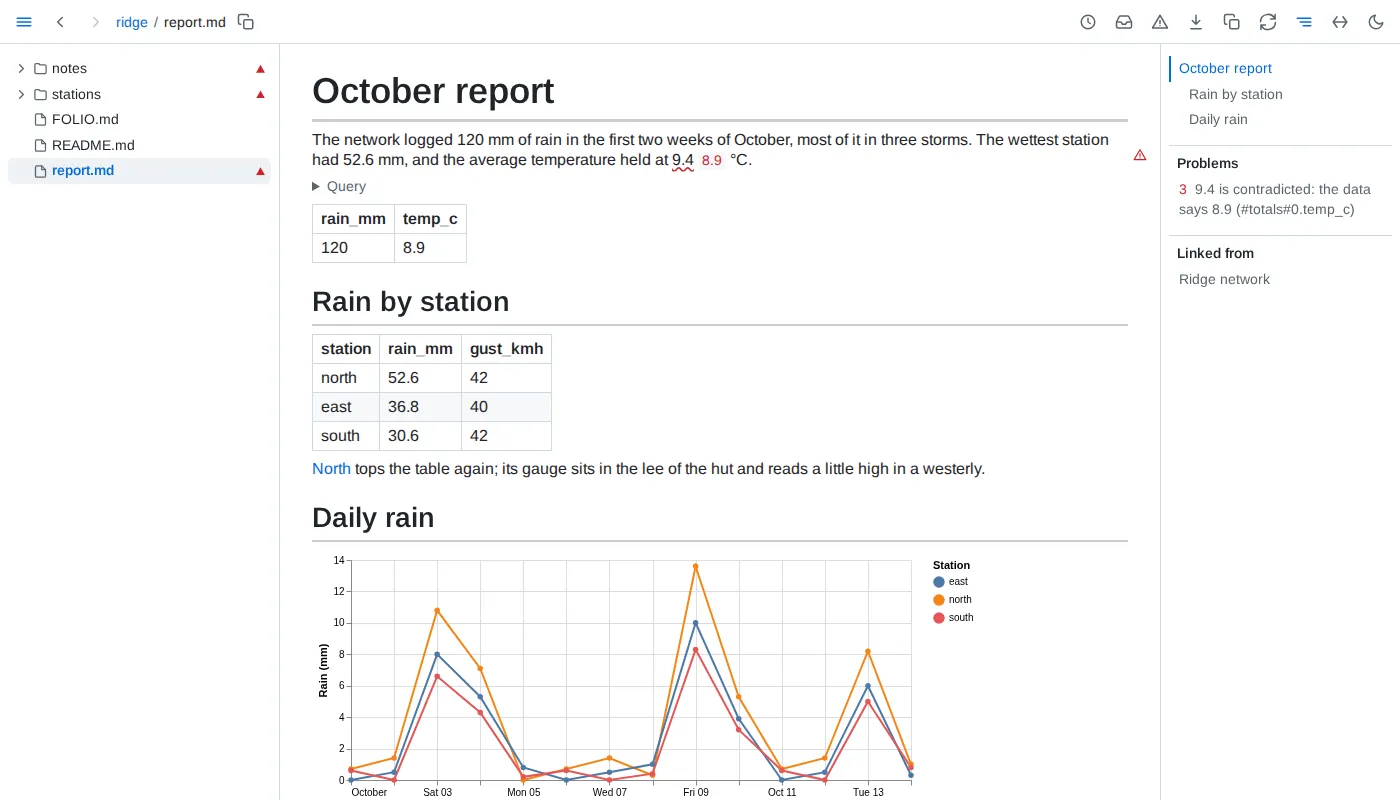
Figures checked against their data - tie a figure in your prose to the value it quotes, <data value="#totals#0.temp_c">9.4</data> °C, and Folio checks it at the precision you typed it with. A figure the data contradicts is underlined in red with the data's value beside it, and a warning sign marks its block; one that agrees reads as plain text. Keep units outside the tag. On GitHub only the figure shows.
Documents as data - the folder's own documents are tables too, with nothing to set up: select path, text from folio.tasks where not done lists every open task in the folder, and folio.documents, folio.headings, folio.links, folio.frontmatter and folio.tables hold the rest of their structure.